
This is part 2 of a two-part blog entry. Click here to read part 1.
From the perspective of future motivation to conserve biodiversity, one of the most troubling signs of nature-deficit-disorder (NDD) is our reduced connection with the natural world, which may manifest as a reduction in our ability to identify common species.
Andrew Balmford and his co-authors conducted a very slick study (Why conservationists should heed Pokémon – great title) of 109 primary-school kids in the UK. They showed each child two sets of flashcards – one with Pokémon characters and the other with wildlife species (plants and animals) that were common in the UK – and compared their performance between sets, i.e., numbers of correct IDs. The youngest kids (age 4) did much better at identifying wildlife than Pokémon characters (mean success rates of 32 vs 7 %, respectively), but by age 8, the reverse was true (mean success rates of 53 % for wildlife vs 78 % for Pokémon). So, not only were older kids more familiar with Pokémon than with wildlife, but also knowledge of Pokémon characters grew by more than an order of magnitude from age 4 to 8, while knowledge of wildlife only grew by about 65 % over the same period.
In a more recent study, French school kids (aged 7-11) were less able to identify species that were common and easily observed in France than to identify exotic species. They also regarded exotic species as being more deserving of protection, regardless of actual conservation status. A widely-cited statistic (but one I can’t verify) is that by the time American kids are seven years old, they can identify 200 corporate logos, but fewer than 10 native species. Even David Attenborough expressed dismay in 2008 after a poll by BBC Wildlife Magazine revealed that British kids (aged 9-11) could not identify some of the most common species in the UK.
Since 2012, I’ve been teaching in the Bachelor of Environmental Studies (BES) Programme at the National University of Singapore (NUS). This past semester, for my section of the BES foundation course, ENV 1101 – Environmental Studies, an Interdisciplinary Overview, I covered the topic of NDD. Inspired by the above studies, I decided to do an informal, in-class version with my 55 students. I created two series of 10 images each. One was a collection of the most iconic or commonly-seen logos (corporate and government) in Singapore (minus any identifying lettering). The other was a collection of the most iconic or commonly-seen wild animals in Singapore (including mammals, birds, reptiles, amphibians, fishes and invertebrates).
I gave students equal time to identify each set, and had them record their answers using Google Forms without any identifying information (personal data). I then scored their answers on a scale of 0-3 according to the level of specificity. For example, if shown the McDonald’s logo, a student would receive a: 1 for ‘restaurant’, 2 for ‘fast-food’, 3 for ‘McDonald’s’. If shown an image of a bald eagle, a student would receive a: 1 for ‘bird’, 2 for ‘eagle’, 3 for ‘bald eagle’. In both series, answers received zeroes when they were left blank or way off the mark.
Students who did better at identifying logos demonstrated a weak tendency to do better at identifying logos (Pearson r2 = 0.3, Fisher’s z = 2.4, p = 0.02). More importantly, students did considerably better (Wilcoxon’s W = 3.5, p < 0.05; fig 1) at identifying logos (mean total score = 27.3 ± 0.5) than animals (mean total score =16.9 ± 0.5. Whereas 40 % of students correctly identified all ten logos, none correctly identified all species of animals. On logos, the minimum total score was 15, and only two students scored lower than 20. In contrast, on animals, the minimum total score was 8, and 15 students (27.2 %) scored below 15.
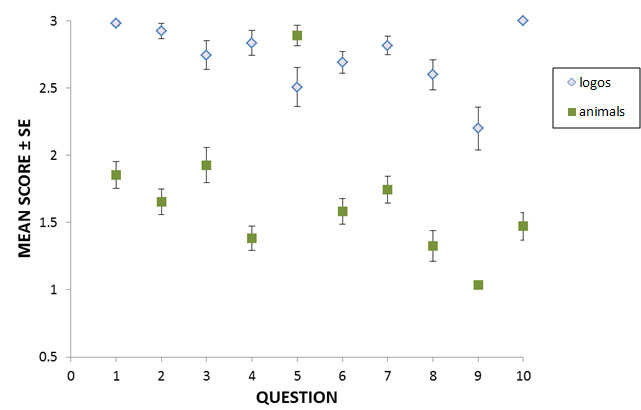
Figure 1. Mean scores on each of 10 questions that required 55 1st-year Bachelor of Environmental Studies students at NUS to identify logos (pale diamonds) or animals (green squares).
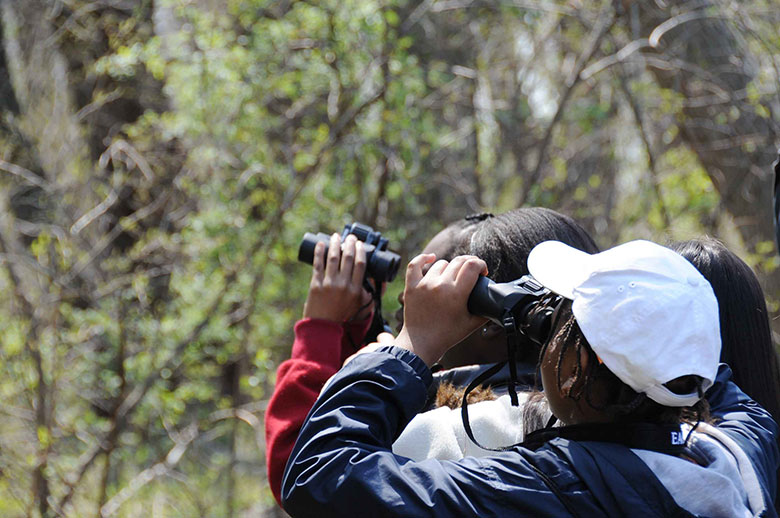
I would add this comparison: All my students are specialising in environmental biology or environmental geography. Although I, like them, did my undergraduate degree in environmental biology, I’ve noticed at least two big differences between them and my own peers (that go beyond those I discussed in part 1 of this blog entry). First, my students may be less committed to environmentalism than we were back then. For example, vegetarianism was far more common among my cohort than among my students. Second, the rate of binocular ownership among BES students is almost nil, whereas the vast majority of my peers not only owned binoculars, but also regularly engaged in activities such as birdwatching. In fact, I’m kind of alarmed by the lack of natural history interest and knowledge displayed by my students (with some notable exceptions), and wonder what results I might obtain by repeating this exercise on the wider student population at NUS. Are they, in fact, even less nature-aware than BES students? And what might all this ultimately mean for the future of conservation in Singapore?
Over the next few years, I hope to expand this study and turn it into a more rigorous examination of this issue. I will also try to find out whether and how this knowledge changes over time and uncover other interesting patterns.